Ten Years of Bay Area Home Prices — the Biggest Gainer Isn't Palo Alto
Post
Everyone has a feeling about Bay Area home prices. Far fewer people have looked at the actual numbers.
So I charted 15 cities' single-family home values from 2016 through 2026 — a full decade. Here's what stands out.
The clearest takeaway: time rewards the people who stayed in
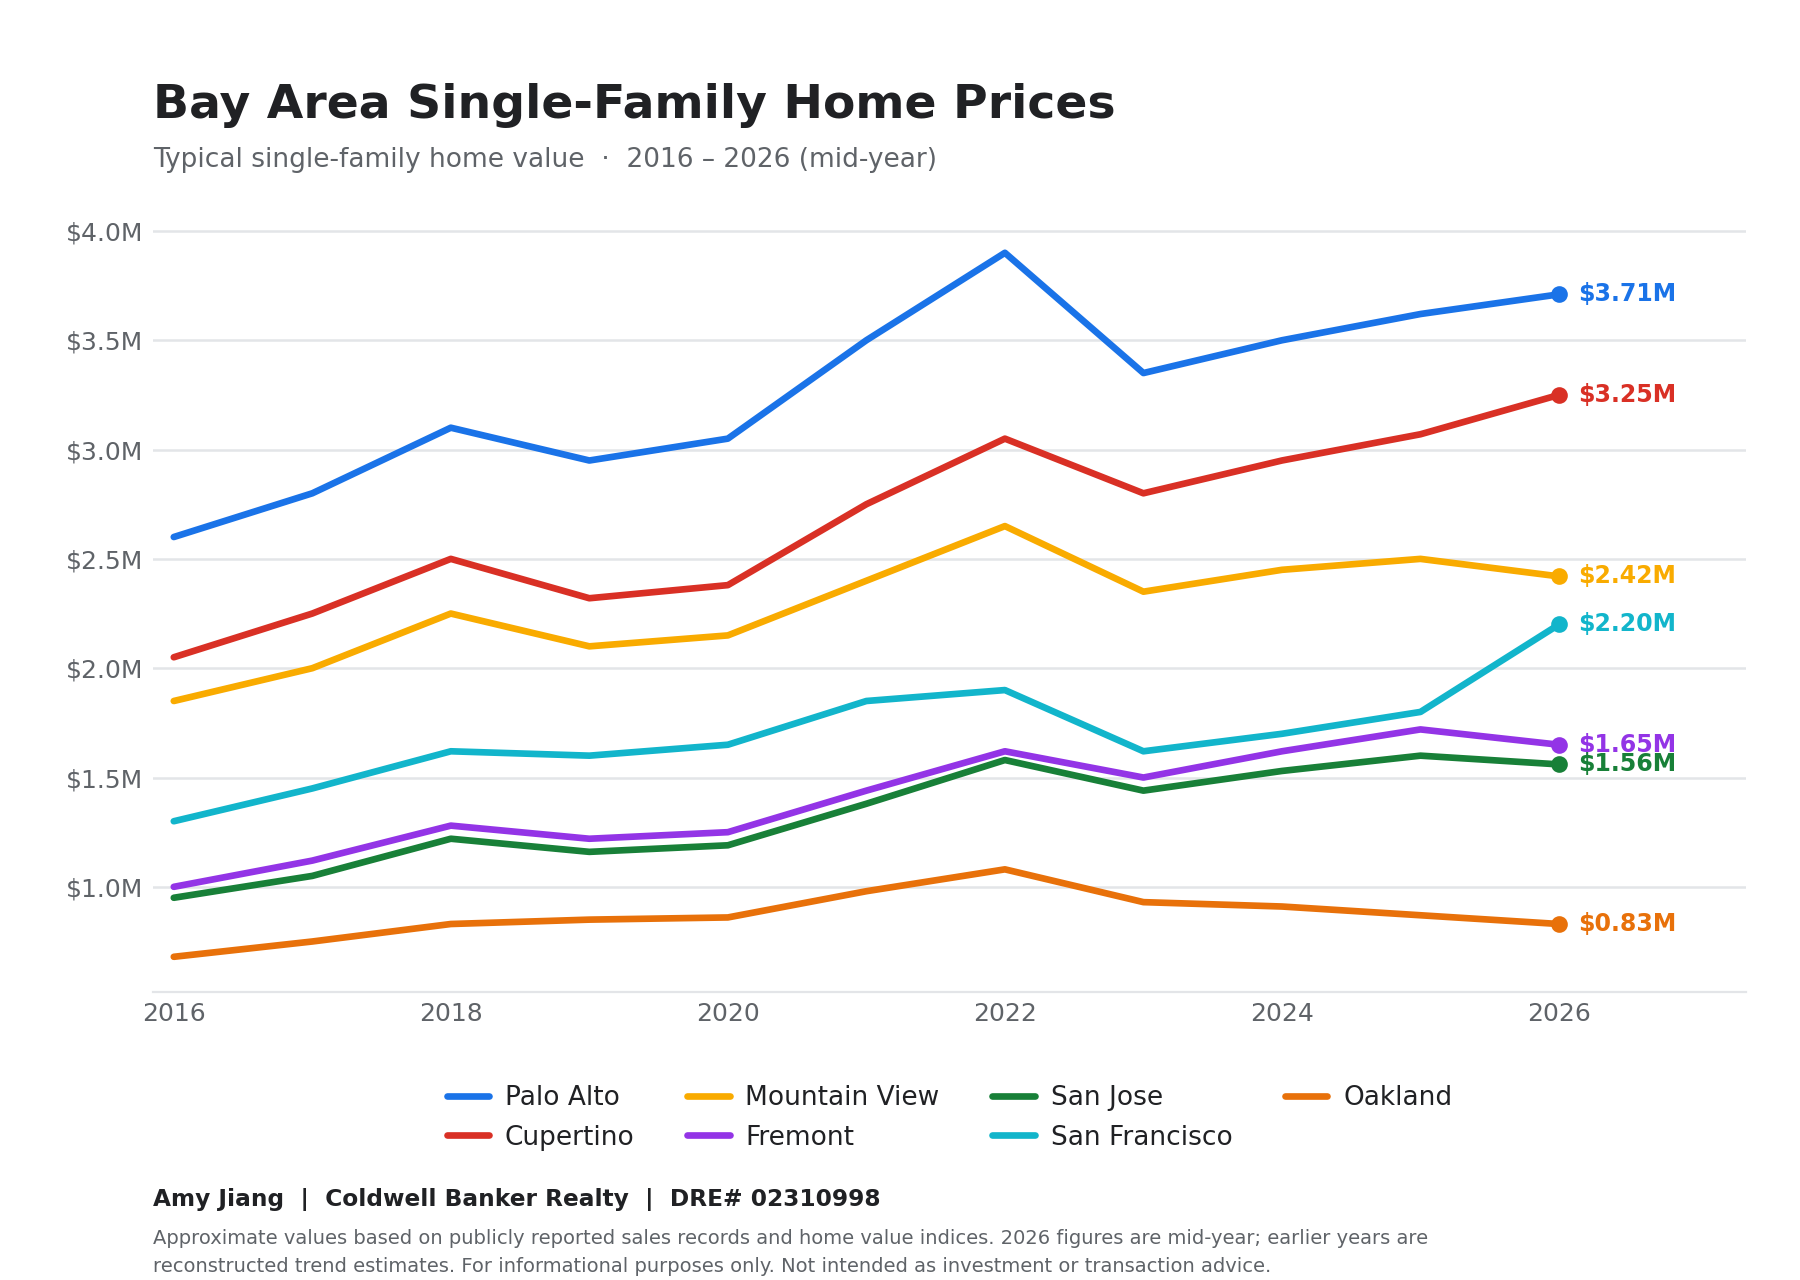
Across the full ten years, every city on the chart trends upward, with total gains clustered between +40% and +70%. Rate cycles, a pandemic, and the shift to remote work all came and went. On a ten-year view, they read as bumps in a rising line.
Four distinct chapters
2016–2019 — Steady climb. Tech IPO wealth pushed values higher at a measured pace.
2020–2022 — Demand surge. Low rates plus remote work sent buyers looking for space. Single-family homes reached a high point in spring 2022, and this is also when detached homes and condos decisively parted ways.
2022 H2–2023 — Rates rise, pace slows. Inventory tightened and transactions took longer. Buyers who moved during this window are, in hindsight, very glad they did.
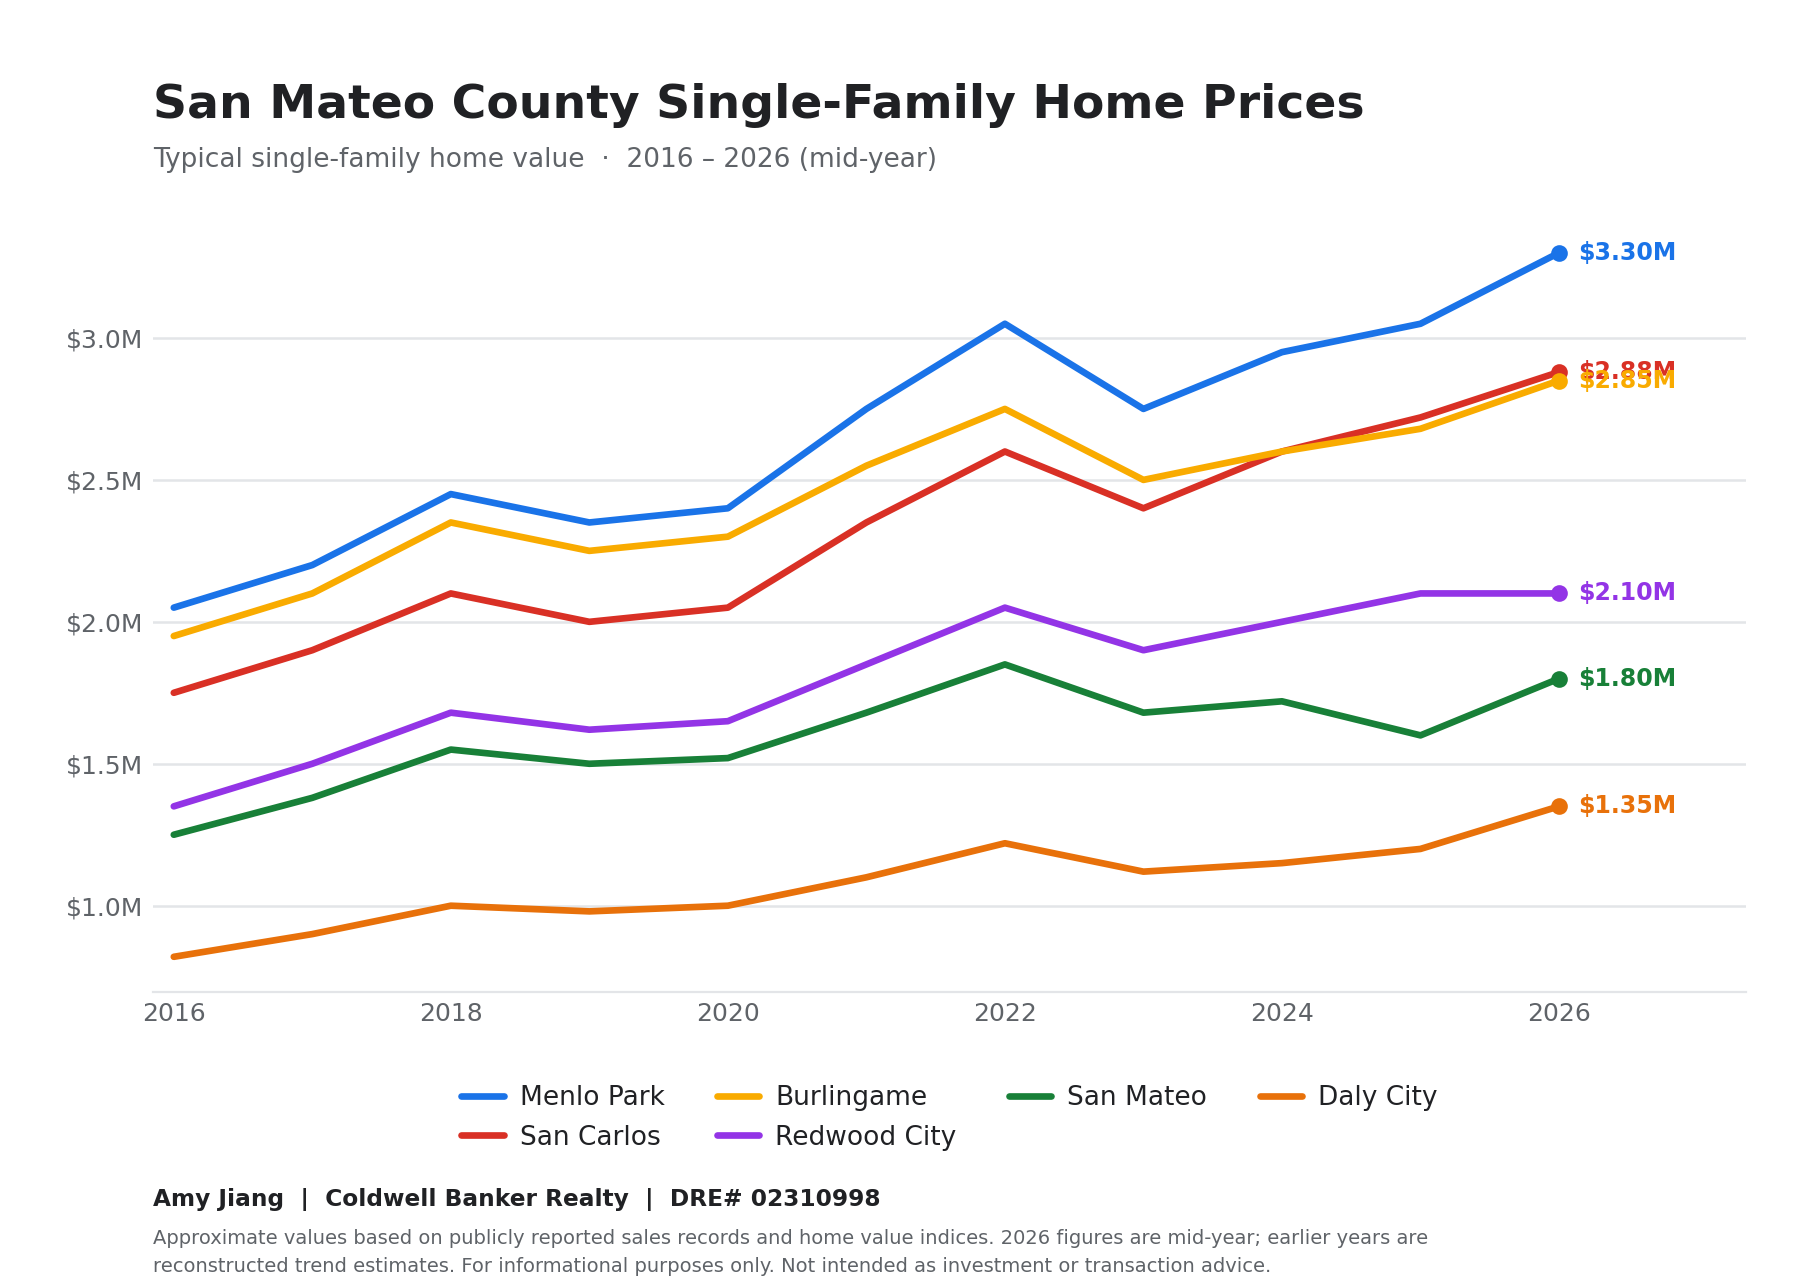
2024–2026 — AI wealth arrives. San Francisco's single-family median reached $2.2M, up 22.2% year over year. San Mateo County reached $2.4M, up 9.1%. The Bay Area single-family median set a record of $1.45M in May 2026.
Three patterns worth knowing
1. Compounding beats timing. Strong cities have annualized roughly 4–5%. Add leverage and the rent you're no longer paying, and the real return to an owner-occupier is considerably higher. The people who waited for a perfect entry point mostly ended up watching.
2. Neighborhood matters more than vintage year. A decade ago, values within a single city spanned about 2x. Today the spread often exceeds 3x. Menlo Park is the clearest example: the citywide median sits near $3.3M, but Belle Haven is around $1.2M while Central Menlo clears $4M. A citywide number tells you very little — the specific street and school attendance area is what drives your outcome.
3. Detached homes and condos are separate markets now. Since 2020 they have moved on genuinely different trajectories. Any analysis that blends them will mislead you.
Ten-year appreciation (approximate)
San Francisco — about +69%. Quiet first half of the decade, then a strong run from 2023 on.
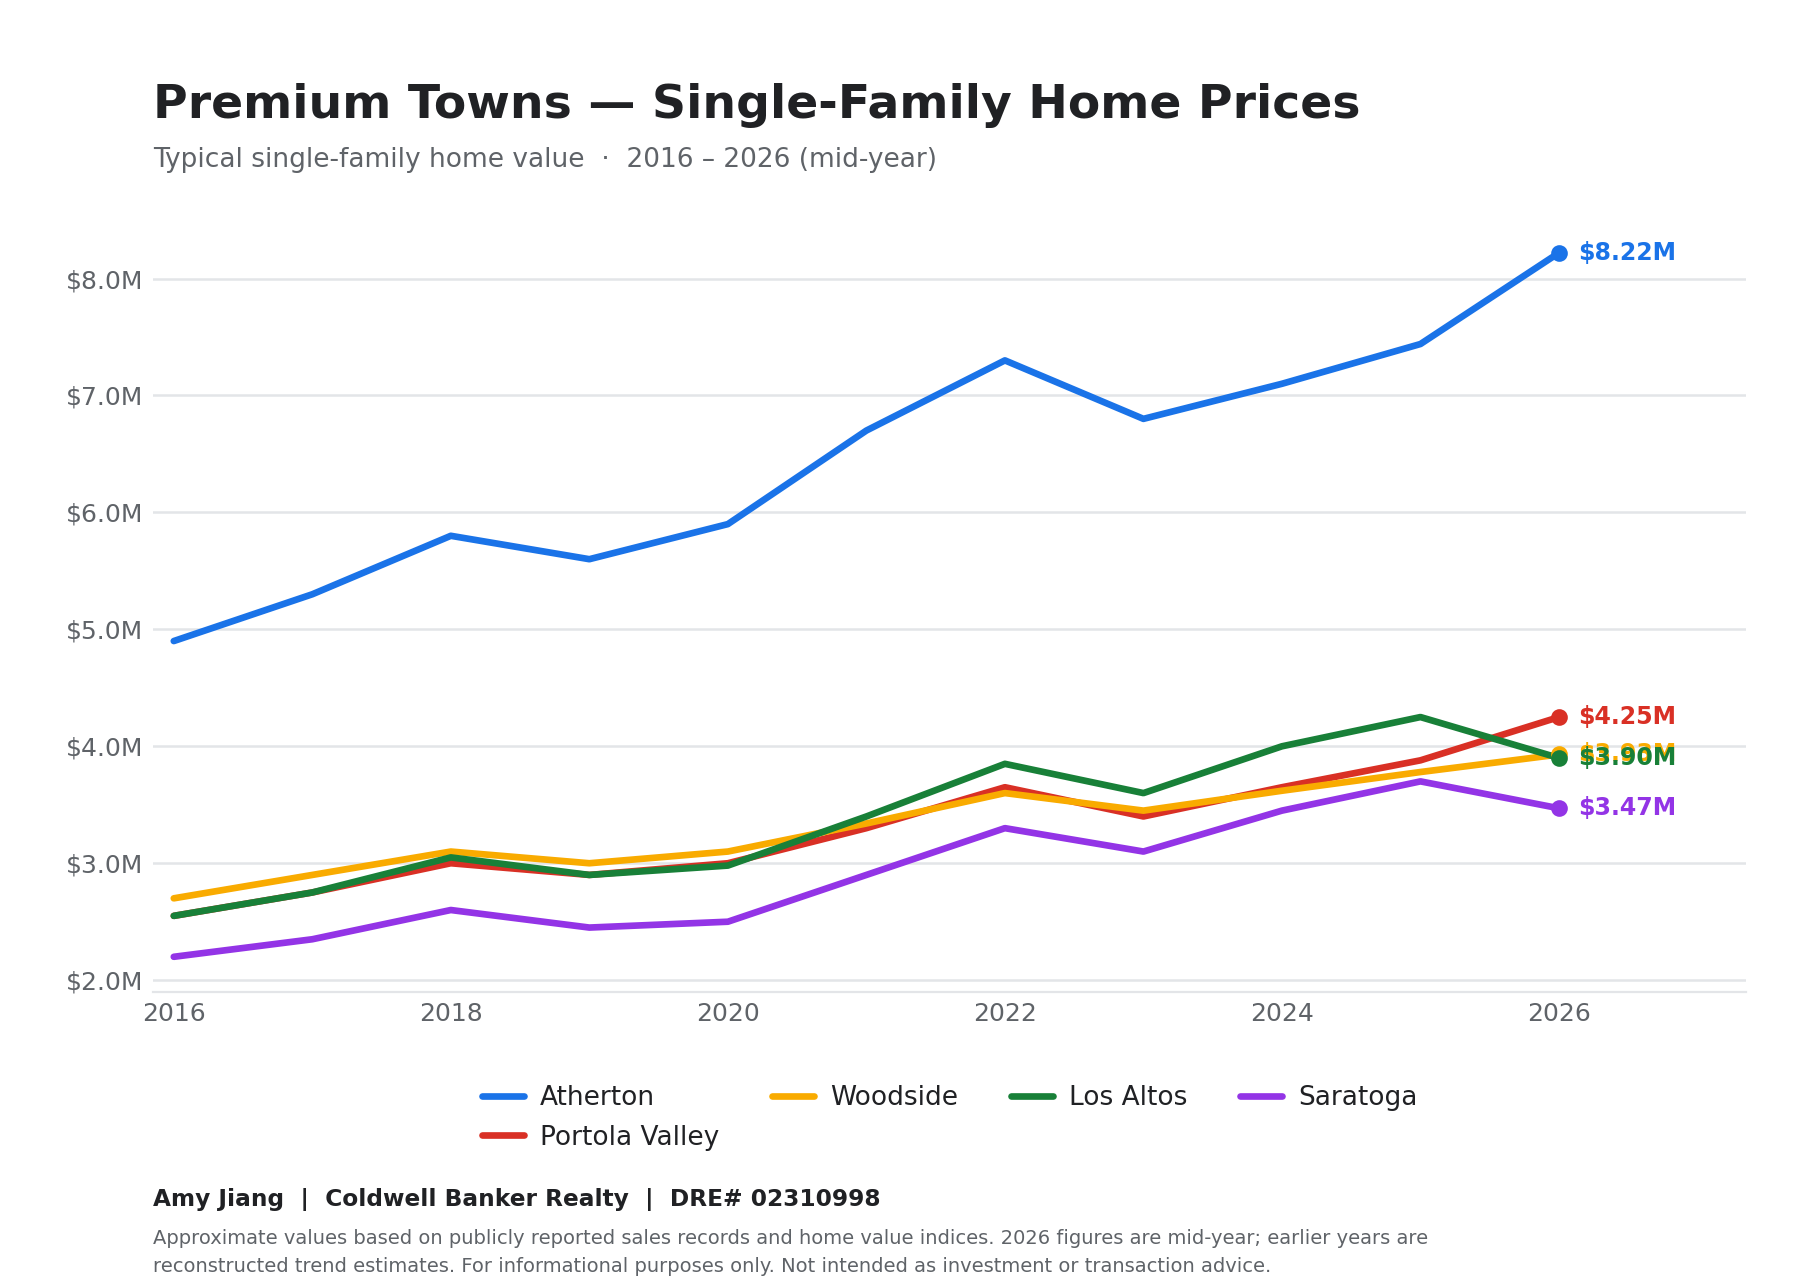
Atherton — about +68%. Consistently upward with virtually no pause.
San Carlos — about +65%. Excellent commute position; set a record high this year.
Menlo Park — about +61%. Meta headquarters effect, strongest in core neighborhoods.
Saratoga — about +58%. Premier schools, durable long-term support.
Los Altos — about +53%. More than half again in value over ten years.
Palo Alto — about +43%. Started from an already high base.
Oakland — about +22%. The most accessible entry point in the region.
Two findings that surprise people
The most famous name isn't the biggest gainer. Palo Alto started from such a high base that its percentage growth is naturally more restrained. The strongest ten-year performers tend to be places that were underestimated early and later pulled forward by industry growth.
The gap between cities dwarfs the gap between years. Choosing the right city and neighborhood has moved the needle far more than buying one or two years earlier or later.
If you're looking right now
The market is running at different speeds depending on where you look. San Francisco and San Mateo County are competitive, with fast timelines and multiple offers. Parts of the South Bay's upper end have healthier inventory, which gives buyers more time to do their homework and more room to negotiate.
So the useful question isn't whether to buy. It's which submarket gives you the best chance of buying the right home.
Data reflects publicly reported sales records and home value indices. 2026 figures are mid-year; earlier years are reconstructed approximations of each market's trend. Provided for informational purposes only and not intended as investment or transaction advice.
Amy Jiang | Star Home Realty | DRE# 02310998